
A computer based system for the assessment of strength capabilities and feedback monitoring of strength training. FiTROdyne Premium registers and displays in both graphical and digital form basic biomechanical parameters involved with weight exercise, i.e. velocity, force, power and displacement.
Principle
The system operates on the Newton´s law of universal gravitation (force equals mass multiplied by gravitational constant) and the Newton´s law of motion (force equals mass multiplied by acceleration).
Instant force while moving barbell of the mass m in vertical direction is calculated as a sum of gravitational force (mass multiplied by gravitational constant) and acceleration force (mass multiplied by acceleration).
Acceleration of vertical movements (positive or negative) is obtained by derivation of vertical velocity, measured by highly precise device, mechanically coupled with barbell or weights of exercise machine (also complex lifting movement like clean and jerk or snatch can be monitored). In addition, power is calculated as a product of force and velocity and the actual position by integration of velocity
Construction
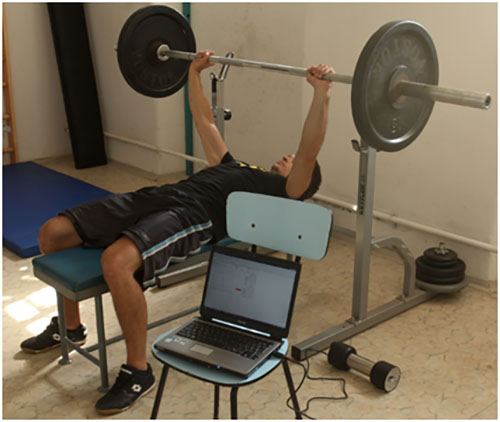
The systems consists of a sensor unit based on precise encoder mechanically coupled with reel. While pulling the tether (connected by means of small hook either to barbell axis or to the weights) out of the reel rotates and measures velocity. Rewinding of the reel is guaranteed by string producing force of about 2 N. The tether can be pulled out to the distance of about 2.5 meter. Signals from sensor unit are conveyed to the PC by means of USB cable.
Software description
Comprehensive software allows to collect, calculate and on-line display the basic biomechanical parameter involved with weight exercise. One can store the data for further analyses of single repetitions or the whole set.
During the diagnostic measurement a movement of symbolic barbell axis and graph of any of derived parameter, i.e. velocity, force, power or acceleration.
After each repetition you receive summary of mean and peak data in digital form, separately for eccentric and concentric phase (Fig. 1).
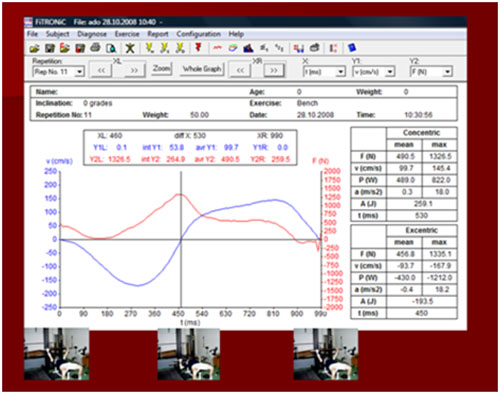
Fig. 1. Summary of data after single bench press repetition.
Should one wish to analyze the single repetition you may assign any of parameters (force, power, velocity, acceleration, position and time) to X, Y1 or Y2 axis. Scaling, i.e definition of minimum, maximum and step of parameter on all 3 axis is available. In addition, while moving the left and right cursors, the digital values of parameters on X, Y1 and Y2 axis are being displayed. Also integral and mean values between both cursors are being actualized.
Using this approach, one can obtain data specifically from acceleration phase (Fig. 2), which may be more relevant for the assessment of explosive strength than values from entire concentric phase.
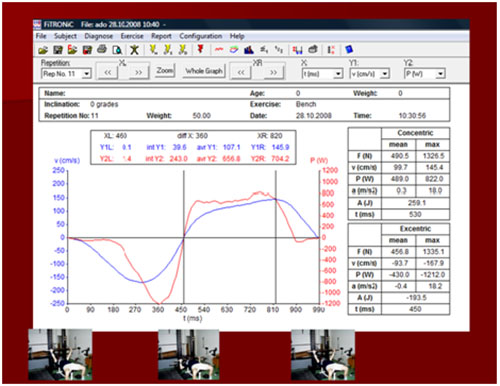
Fig. 2. Data from acceleration phase of single bench press repetition
Such an analysis may for example demonstrate nicely the differences in time course of force, power and velocity between repetitions performed in slow or fast way, with or without counter movement, etc. (Fig.3).
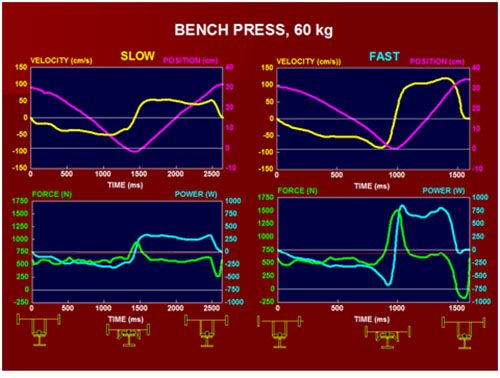
Fig. 3. Basic parameters (force, velocity, power and barbell position) during single bench press repetitions performed at low, vs. High velocity in concentric phase.
The calibration of the system is software driven and basically very simple. This is due to simultaneous registration of velocity and distance. According to instructions on the screen you only have to pull the tether the defined distance between 50 and 100 cm (system calibrates the distance) and then to pull at least 50 cm with medium velocity (system calibrates the velocity). The calibration is in fact stable a recalibration is necessary only if you use exercise machine, in which – due to other than 1:1 levering – the weights are moved with different velocity than axis at which force is being applied. In this case you move the axis while performing calibration.
Testing Protocols
Typical test routine consists of set of repetitions performed with maximla effort from lower weights (e.g. 20 kg in bench press) with steps of 10 kg up to the maximum. There is a special menu driven software routine for this a procedure. From such a test series you can obtain the individual force-velocity and power-velocity curves allowing you to assess the force and power at the velocities used in sports specific movements (Fig. 3). One can also obtain the value of maximal power, as well as the corresponding weight (which lifting at maximnal effort yields maximal power). Using maximal power, incorporating both, strength and velocity as well as force and power produced at high velocities represents more sensible approach for performance prediction as well as for detection of specific adaptation changes due to various forms of weight training (e.g. slow or dynamic) than the one based on simple 1 RM.
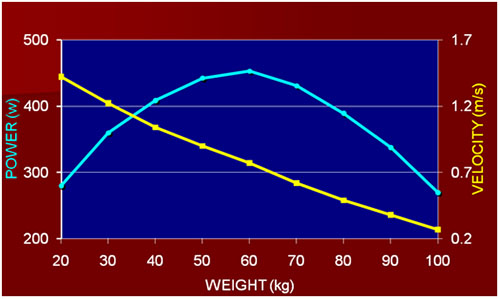
Fig. 4. Mean velociy and power in concentric phase of bench press while lifting different weights.
There is a software routine alowing to monitor the parameters (e.g. mean power or peak power) in concetric phase of particular repetitions during a set of weight exercise. Parameters derived from such a set of e.g. 15 repetitions, i.e. average power, maximal power, meaan power and fatigue index (Fig. 4) can be utilisied for the evaluation of strength endurance.
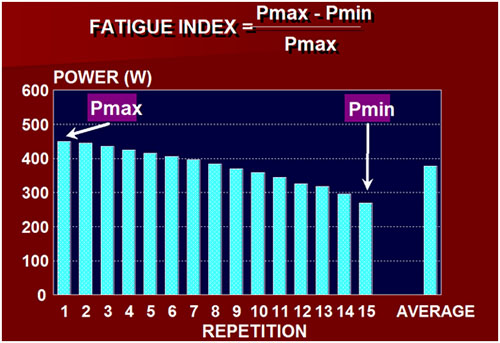
Fig. 5. Mean power in concetric phase of bench presses in a set of 15 repetitions
The same software routine can be used for feedback monitoring of weight training. Power output of each repetition is displayed on the screen. If performed in an all-out way there is usually decrease in power production with each repetition. Drop under preset critical level will be indicated visually as well as by an acustic signal. The individual patterns (Fig. 6) depends on various factors, e,g, age, sex, individual morphological dispositions (FT/ST muscle fiber ratio), state of conditioning, etc.
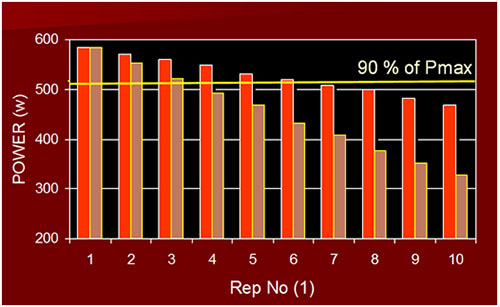
Fig. 6. Mean power in concentric phase in a set of 10 repetitions performed with maximal effort in 2 subjects.
In resistance training focused on improvement of explosive strength and power only high intensity repetitions (above 90 % of a maximum power) are considered to be the efficient stimuli. Lower intensity repetitions may enhance stregth endurance, but have hardly any significant effect on explosive power. Feedback monitoring of power during strength exercise may, therefore, help to avoid low intensity exrecise and improve efficiency of training.
Main parameters obtained
- Maximal mean power from entire concentric phase
- Maximal peak power from entire concentric phase
- Maximal mean power from acceleration concentric phase
- Maximal peak power from acceleration concentric phase
- Fatigue index
Application areas
Strength testing and feedback monitoring of strength exercise in
elite sport, rehabilitation and sport science.


